logstash + elasticsearch + kibana大資料搜集架構
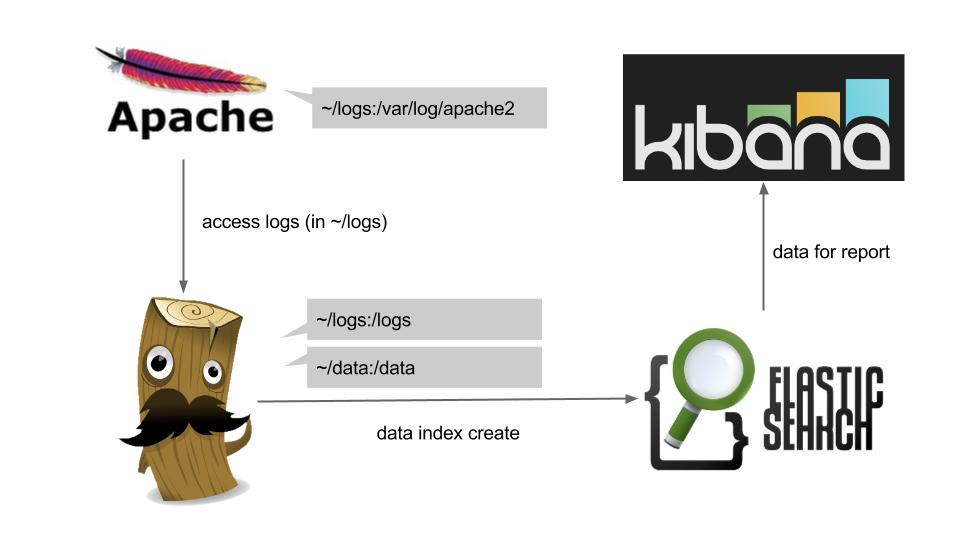
logstash + elasticsearch + kibana是目前Apache.org推出的一個搜集大資料的架構,下面來說明如何使用這個架構來蒐集您Apache網站的log資料,最後以圖表(Kibana)的方式呈現給大家... 概念上架構如下:
Prepare
- ~\/logs: 用以儲存apache log
- ~\/data: 放置logstash所需要的config file
mkdir ~/logs
mkdir ~/data
準備logstash config file: ~\/data\/apache.conf
input {
  file {
    path => "/logs/access.log"
    start_position => beginning
  }
}

filter {
  if [path] =~ "access" {
    mutate { replace => { "type" => "apache_access" } }
    grok {
      match => { "message" => "%{COMBINEDAPACHELOG}" }
    }
  }
  date {
    match => [ "timestamp" , "dd/MMM/yyyy:HH:mm:ss Z" ]
  }
}

output {
  elasticsearch {
    host => es
  }
  stdout { codec => rubydebug }
}
其中input的部分,\/logs\/access.log為預計logstash server掛載後的log位置;output中的"hot => es"為預計elasticsearch server啟動時所用的名稱(--name es),並且提供給logstash server掛載。
Start apache
啟動Apache,並且掛載本地端~\/logs作為apache log儲存資料匣。
docker run -d -p 80:80 --name apache2 -v ~/logs:/var/log/apache2 peihsinsu/apache2-runtime
Start elasticsearch
啟動ElasticSearch服務,並指定instance name為: es。
docker run -d -p 9200:9200 -p 9300:9300 --name es elasticsearch
Start logstash
啟動logstash服務,並鏈結ElasticSearch(--link es:es),以及掛載~\/logs, ~\/data,其中~\/data\/apache.conf為logstash所要吃的apache log設定擋。
docker run -d -v ~/logs:/logs -v ~/data:/data --link es:es peihsinsu/logstash \
  /logstash-1.4.2/bin/logstash -f /data/apache.conf
這個步驟也可以用手動模式啟動,如下:
$ docker run -it -v ~/logs:/logs -v ~/data:/data --link es:es peihsinsu/logstash bash
# /logstash-1.4.2/bin/logstash -f /data/apache.conf
或是使用logstash的runtime封裝方式來執行
docker run -d -v ~/logs:/logs -v ~/data:/data -e cfg=apache.conf --link es:es peihsinsu/logstash-runtime
Start kibana
最後啟動kibana服務,由於在這邊我們bypas安全性設定,因此啟動時候需要多加參數"-e KIBANA_SECURE=false"來乎略https的強制存取:
docker run -d -p 8000:80 -e KIBANA_SECURE=false --link es:es balsamiq/docker-kibana
測試
所有服務都ready後,可以透過簡單的curl或是ab benchmark來測試,來產生實際的流量...
ab -c 50 -n 50 -t 10 http://my-server-ip/
This is ApacheBench, Version 2.3 <$Revision: 1554214 $>
Copyright 1996 Adam Twiss, Zeus Technology Ltd, http://www.zeustech.net/
Licensed to The Apache Software Foundation, http://www.apache.org/

Benchmarking my-server-ip (be patient)
Finished 427 requests


Server Software:        Apache/2.2.22
Server Hostname:        my-server-ip
Server Port:            80

Document Path:          /
Document Length:        177 bytes

Concurrency Level:      50
Time taken for tests:   10.479 seconds
Complete requests:      427
Failed requests:        0
Total transferred:      192150 bytes
HTML transferred:       75579 bytes
Requests per second:    40.75 [#/sec] (mean)
Time per request:       1227.005 [ms] (mean)
Time per request:       24.540 [ms] (mean, across all concurrent requests)
Transfer rate:          17.91 [Kbytes/sec] received

Connection Times (ms)
              min  mean[+/-sd] median   max
Connect:       52  428 311.2    376    1648
Processing:   188  584 946.1    395    6042
Waiting:      187  577 944.1    392    6042
Total:        307 1012 985.6    790    6318

Percentage of the requests served within a certain time (ms)
  50%    790
  66%    849
  75%    880
  80%    896
  90%   1756
  95%   3914
  98%   4418
  99%   6275
 100%   6318 (longest request)
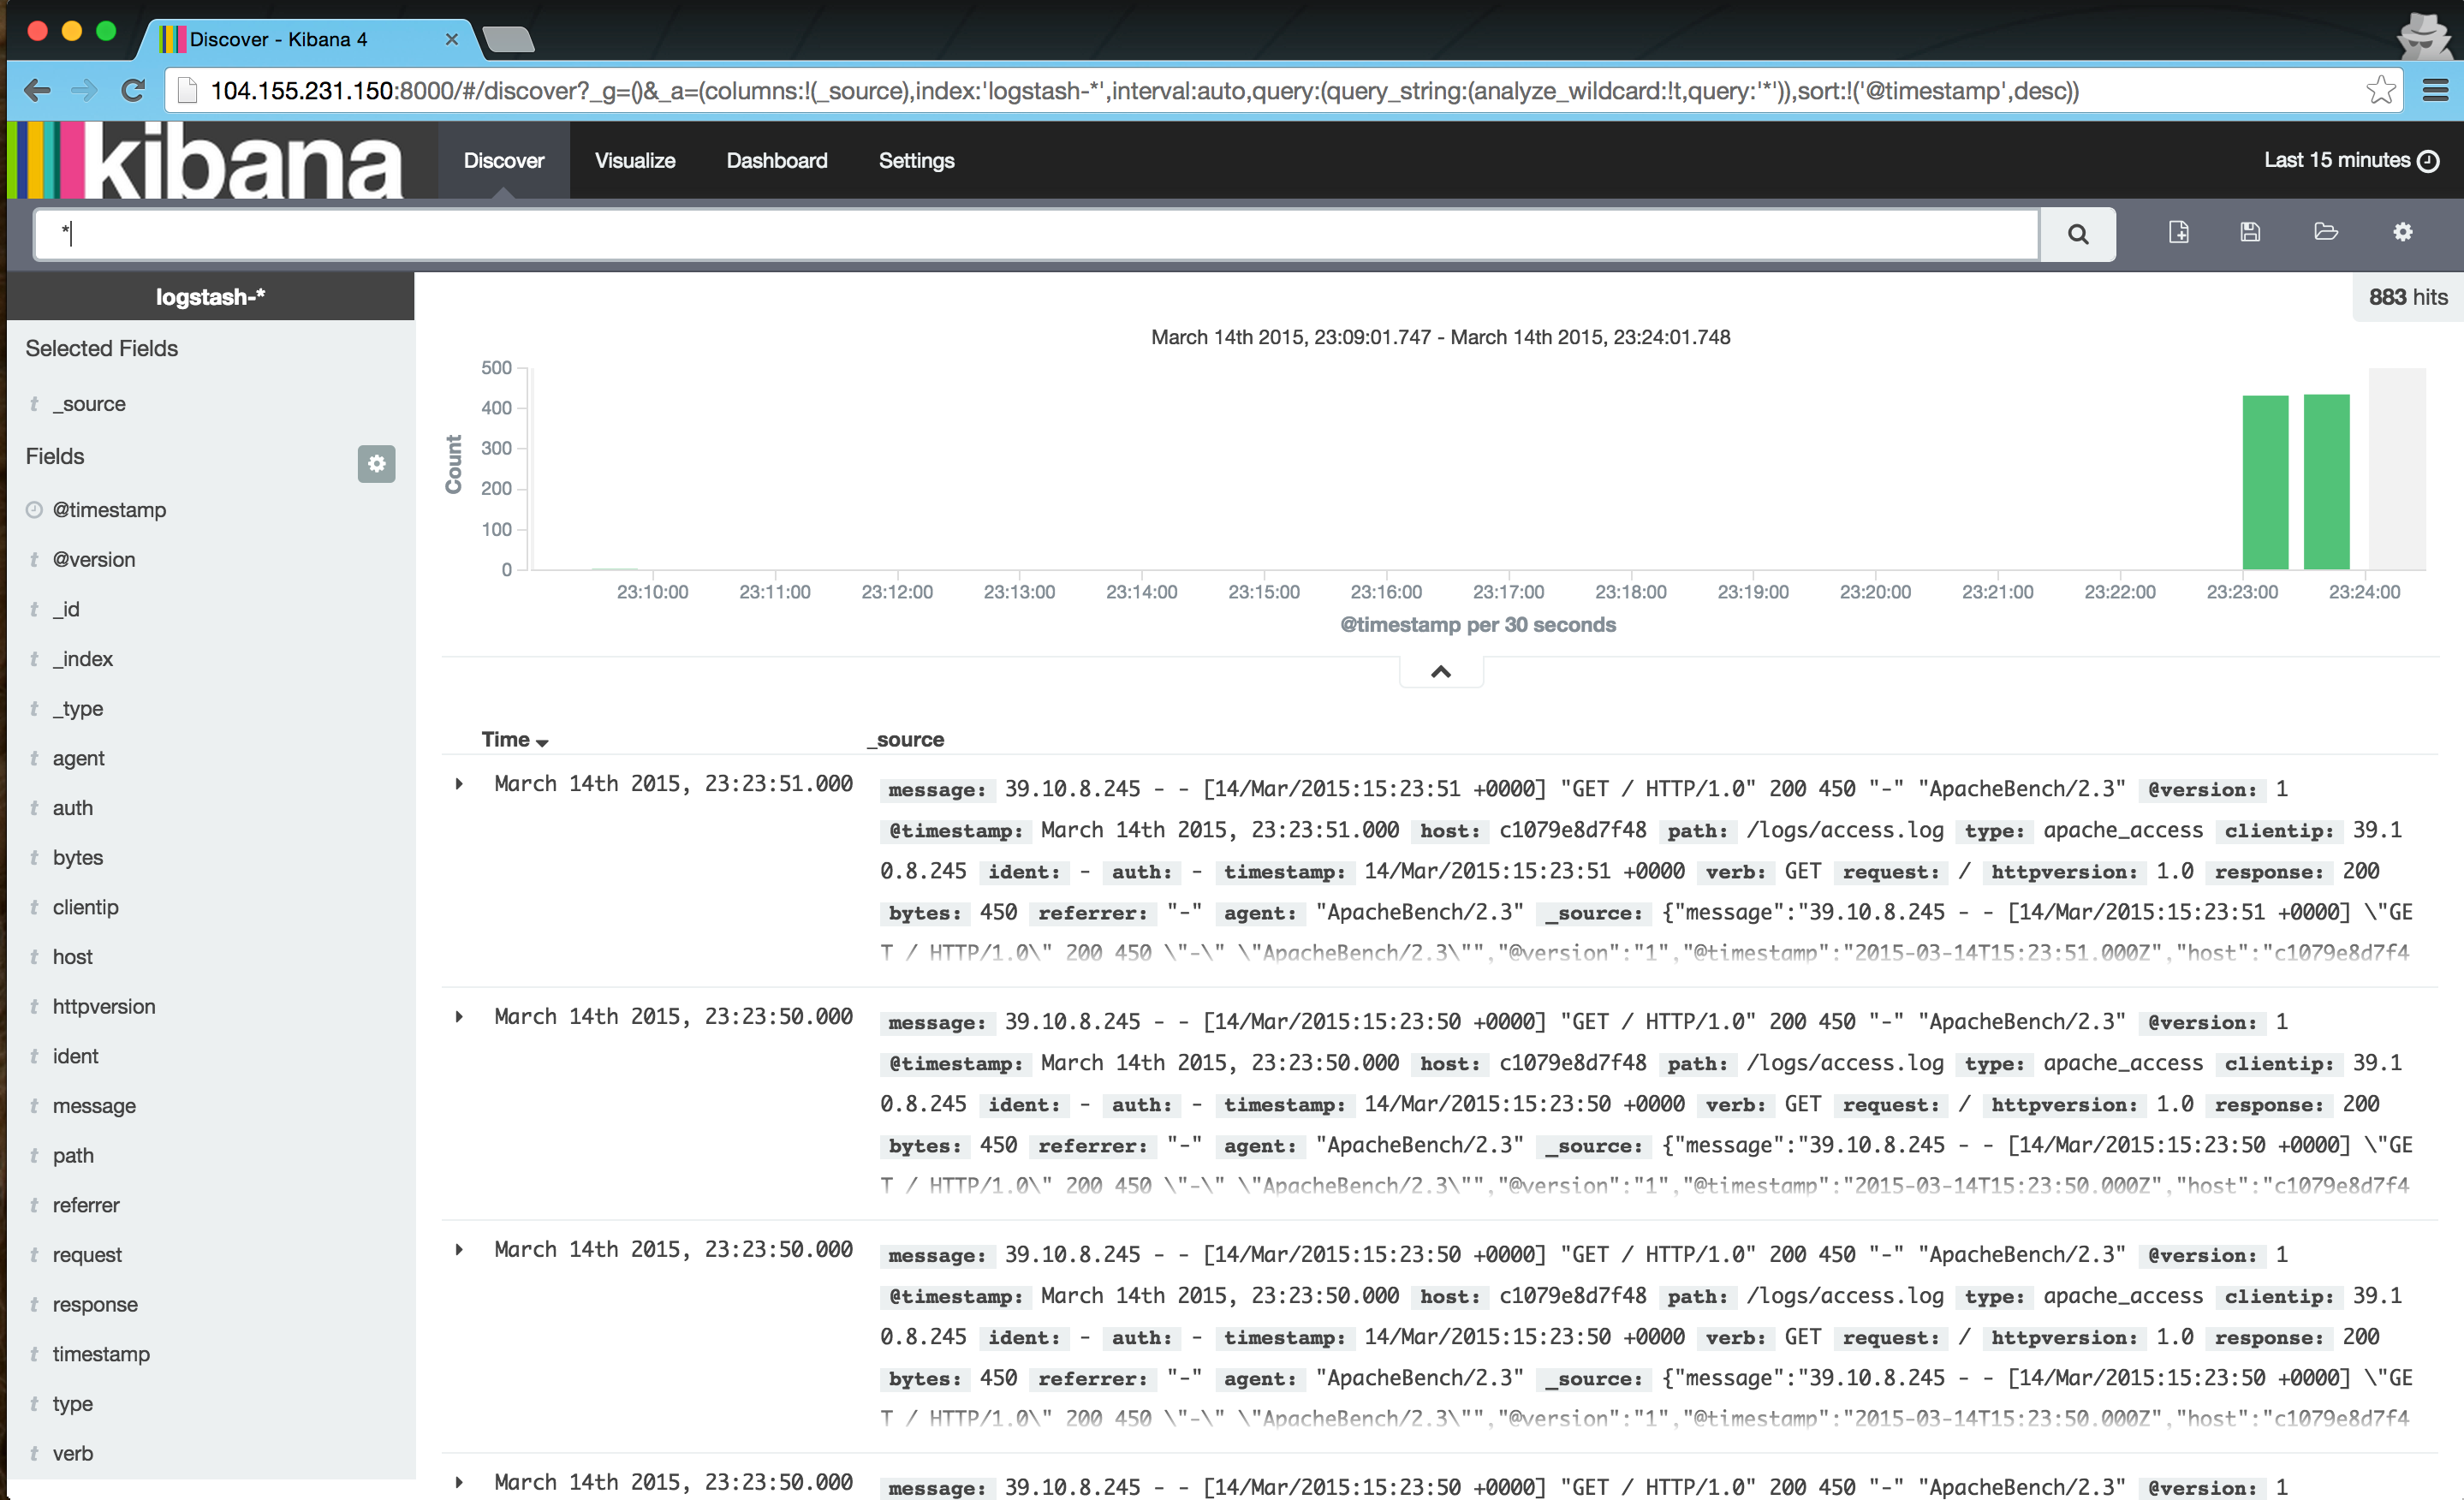
最後我們可以直接登入Kibana服務的8000 port觀看最後的結果:
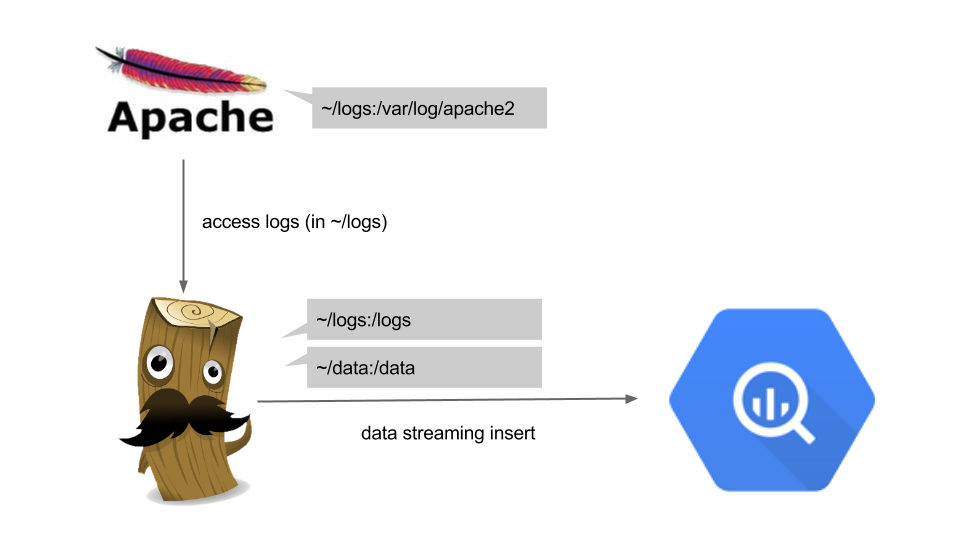
除了ElasticSearch之外的大資料選擇 - Google BigQuery
在這邊,我們也可以在執行logstash時候,直接將data往Google Cloud中的大資料處理中心: BigQuery丟...
下面是logstash output BigQuery的設定檔(~\/data\/apache2bq.conf)。
input {
  file {
    path => "/logs/access.log"
    exclude => "*.gz"
  }
}

filter {
  grok {
    pattern => "%{COMBINEDAPACHELOG}"
  }
  date {
    match => ["timestamp", "dd/MMM/yyyy:HH:mm:ss Z"]
    locale => "en"
    remove_field => ["timestamp"]
  }
}

output {
  google_bigquery {
    project_id => "my-project-id"
    dataset => "logs"
    csv_schema => "message:STRING,version:STRING,timestamp:STRING,host:STRING,path:STRING,clientip:STRING,ident:STRING,auth:STRING,verb:STRING,request:STRING,httpversion:STRING,response:STRING,bytes:STRING,referrer:STRING,agent:STRING"
    key_path => "/data/mykey.p12"
    key_password => "notasecret"
    service_account => "28817350178...n1h@developer.gserviceaccount.com"
    temp_directory => "/tmp/logstash-bq"
    temp_file_prefix => "logstash_bq"
    date_pattern => "%Y-%m-%dT%H:00"
    flush_interval_secs => 2
    uploader_interval_secs => 30
    deleter_interval_secs => 30
  }
  stdout { codec => rubydebug }
}
此設定檔中,幾個必要的設定為:
- project_id: 必須為google cloud platform中的專案,並且已經enable billing
- dataset: 欲儲存資料的dataset名稱,必須已經建立該dataset
- csv_schema: 所輸入資料的Schema,在此搭配csv input,設定為csv方式的schema
- key_path: 在Google Cloud Console上創建service account後下載的p12金鑰
- service_account: 在Google Cloud Console上創建service account後,所給定的account id
接著,透過下面方式啟動logstash-runtime docker即可開始匯入apache log到BigQuery
docker run -d -v ~/logs:/logs -v ~/data:/data -e cfg=apache2bq.conf peihsinsu/logstash-runtime