使用SNMP監控Linux CPU並整合Google Cloud Monitor
Google Cloud Monitor是什麼
Google Cloud Monitor簡單的說是Cloud Monitor API與StackDriver服務的總和。Google透過Cloud Monitor提供所有Google Cloud上的一些操作記錄以及讓開發者可以自訂自己的Monitor來在同一個平台上監控。
下面展示的是透過SNMP來蒐集主機的CPU資訊,並且透過Google Cloud Monitor來蒐集這些資訊,呈現在StackDriver的Dashboard上。
SNMP CPU資訊設定
如前面SNMP章節所建,我們可以在snmpd.conf中加入CPU load average的設定,讓SNMP可以讀到CPU的資訊。
# vim /etc/snmp/snmpd.conf
(skip)
1 minute Load: .1.3.6.1.4.1.2021.10.1.3.1
5 minute Load: .1.3.6.1.4.1.2021.10.1.3.2
15 minute Load: .1.3.6.1.4.1.2021.10.1.3.3
(skip)
修改完成後,請restart snmp daemon已更新執行狀態。
Create monitor to metrics script
在轉入資料到Cloud Monitor中的部分,需要透過一些程式來進行,下面是欲透過fluentd exec模組來塞資料進到Cloud Monitor的程式片段,目的是從fluentd exec收到欲轉入到Cloud Monitor的資料,並且將資料輸入到Cloud Monitor...
接收到的資料範例:
{"name":"UCD-SNMP-MIB::laLoad.1","value":0.0}
{"name":"UCD-SNMP-MIB::laLoad.2","value":0.0}
{"name":"UCD-SNMP-MIB::laLoad.3","value":0.0}
test.js的部分:
//file: test.js
var fs = require('fs');
var metric = require('gcmetrics');
var txt = fs.readFileSync(process.argv[2],'utf8');
var project_id = 'mitac-cp300-taipei101';

metric.init({
  scope: 'https://www.googleapis.com/auth/monitoring',
  client_email: "your-service-account@developer.gserviceaccount.com",
  key_pem: "/path/to/your/pem"
});

function insert(metricid, cid, value) {
  metric.writeTimeSeries(
    project_id,
    metricid,
    value,
    {"custom.cloudmonitoring.googleapis.com/laLoad" : cid},
    null,
    null,
    function(err, req, doc){
        if(err) console.log('ERROR:', err);
        console.log(doc);
    });
}

if(txt)
txt.split('\n').forEach(function(line){
  if(line.length > 0) {
    var vo = JSON.parse(line);
    console.log('vo:', vo);
    if(vo)
      insert('cpuloadavg', vo.name, vo.value);
  }
})
這段程式是透過Node.js撰寫,因此如果未安裝Node.js程式,則需要先行安裝... 安裝後需要另外安裝gcmetrics模組,可以在您的程式路徑執行下面指令安裝:
$ npm init
...(skip)
$ npm install gcmetrics --save
Fluentd設定
完成上面程式後,在fluentd端,可以按照下面設定:
<source>
  type snmp
  tag snmp.server1
  nodes name, value
  host localhost
  community idv90we3rnov90wer # 這是config檔案中的community的設定
  mib laLoad.1, laLoad.2, laLoad.3
  mib_modules UCD-SNMP-MIB
  method_type get
  polling_time 5
  polling_type async_run
</source>

<match **>
  type copy
  <store>
    type stdout
    output_type json
  </store>
  <store>
    type exec
    command /opt/node/bin/node /path/to/your/test.js
    format json
    time_format %Y-%m-%d %H:%M:%S
    flush_interval 5s
    buffer_path    /tmp/
  </store>
</match>
上面的設定,原則上會每5秒鐘到snmp端口查詢snmp資料,並且把資料丟給test.js做處理...
Google Cloud Monitor - StackDriver設定
完成了Fluentd與Cloud Monitor程式的設定後,接下來我們可以透過Google Cloud Monitor(StackDriver)來建置即時監控的報表:
首先,可以在StackDriver中找到自訂Dashboard(Dashboards > Create...),然後點選右上角的"Add Chart"來建立自己的圖表:

如果一切無誤,則可以看到類似這樣的圖表:

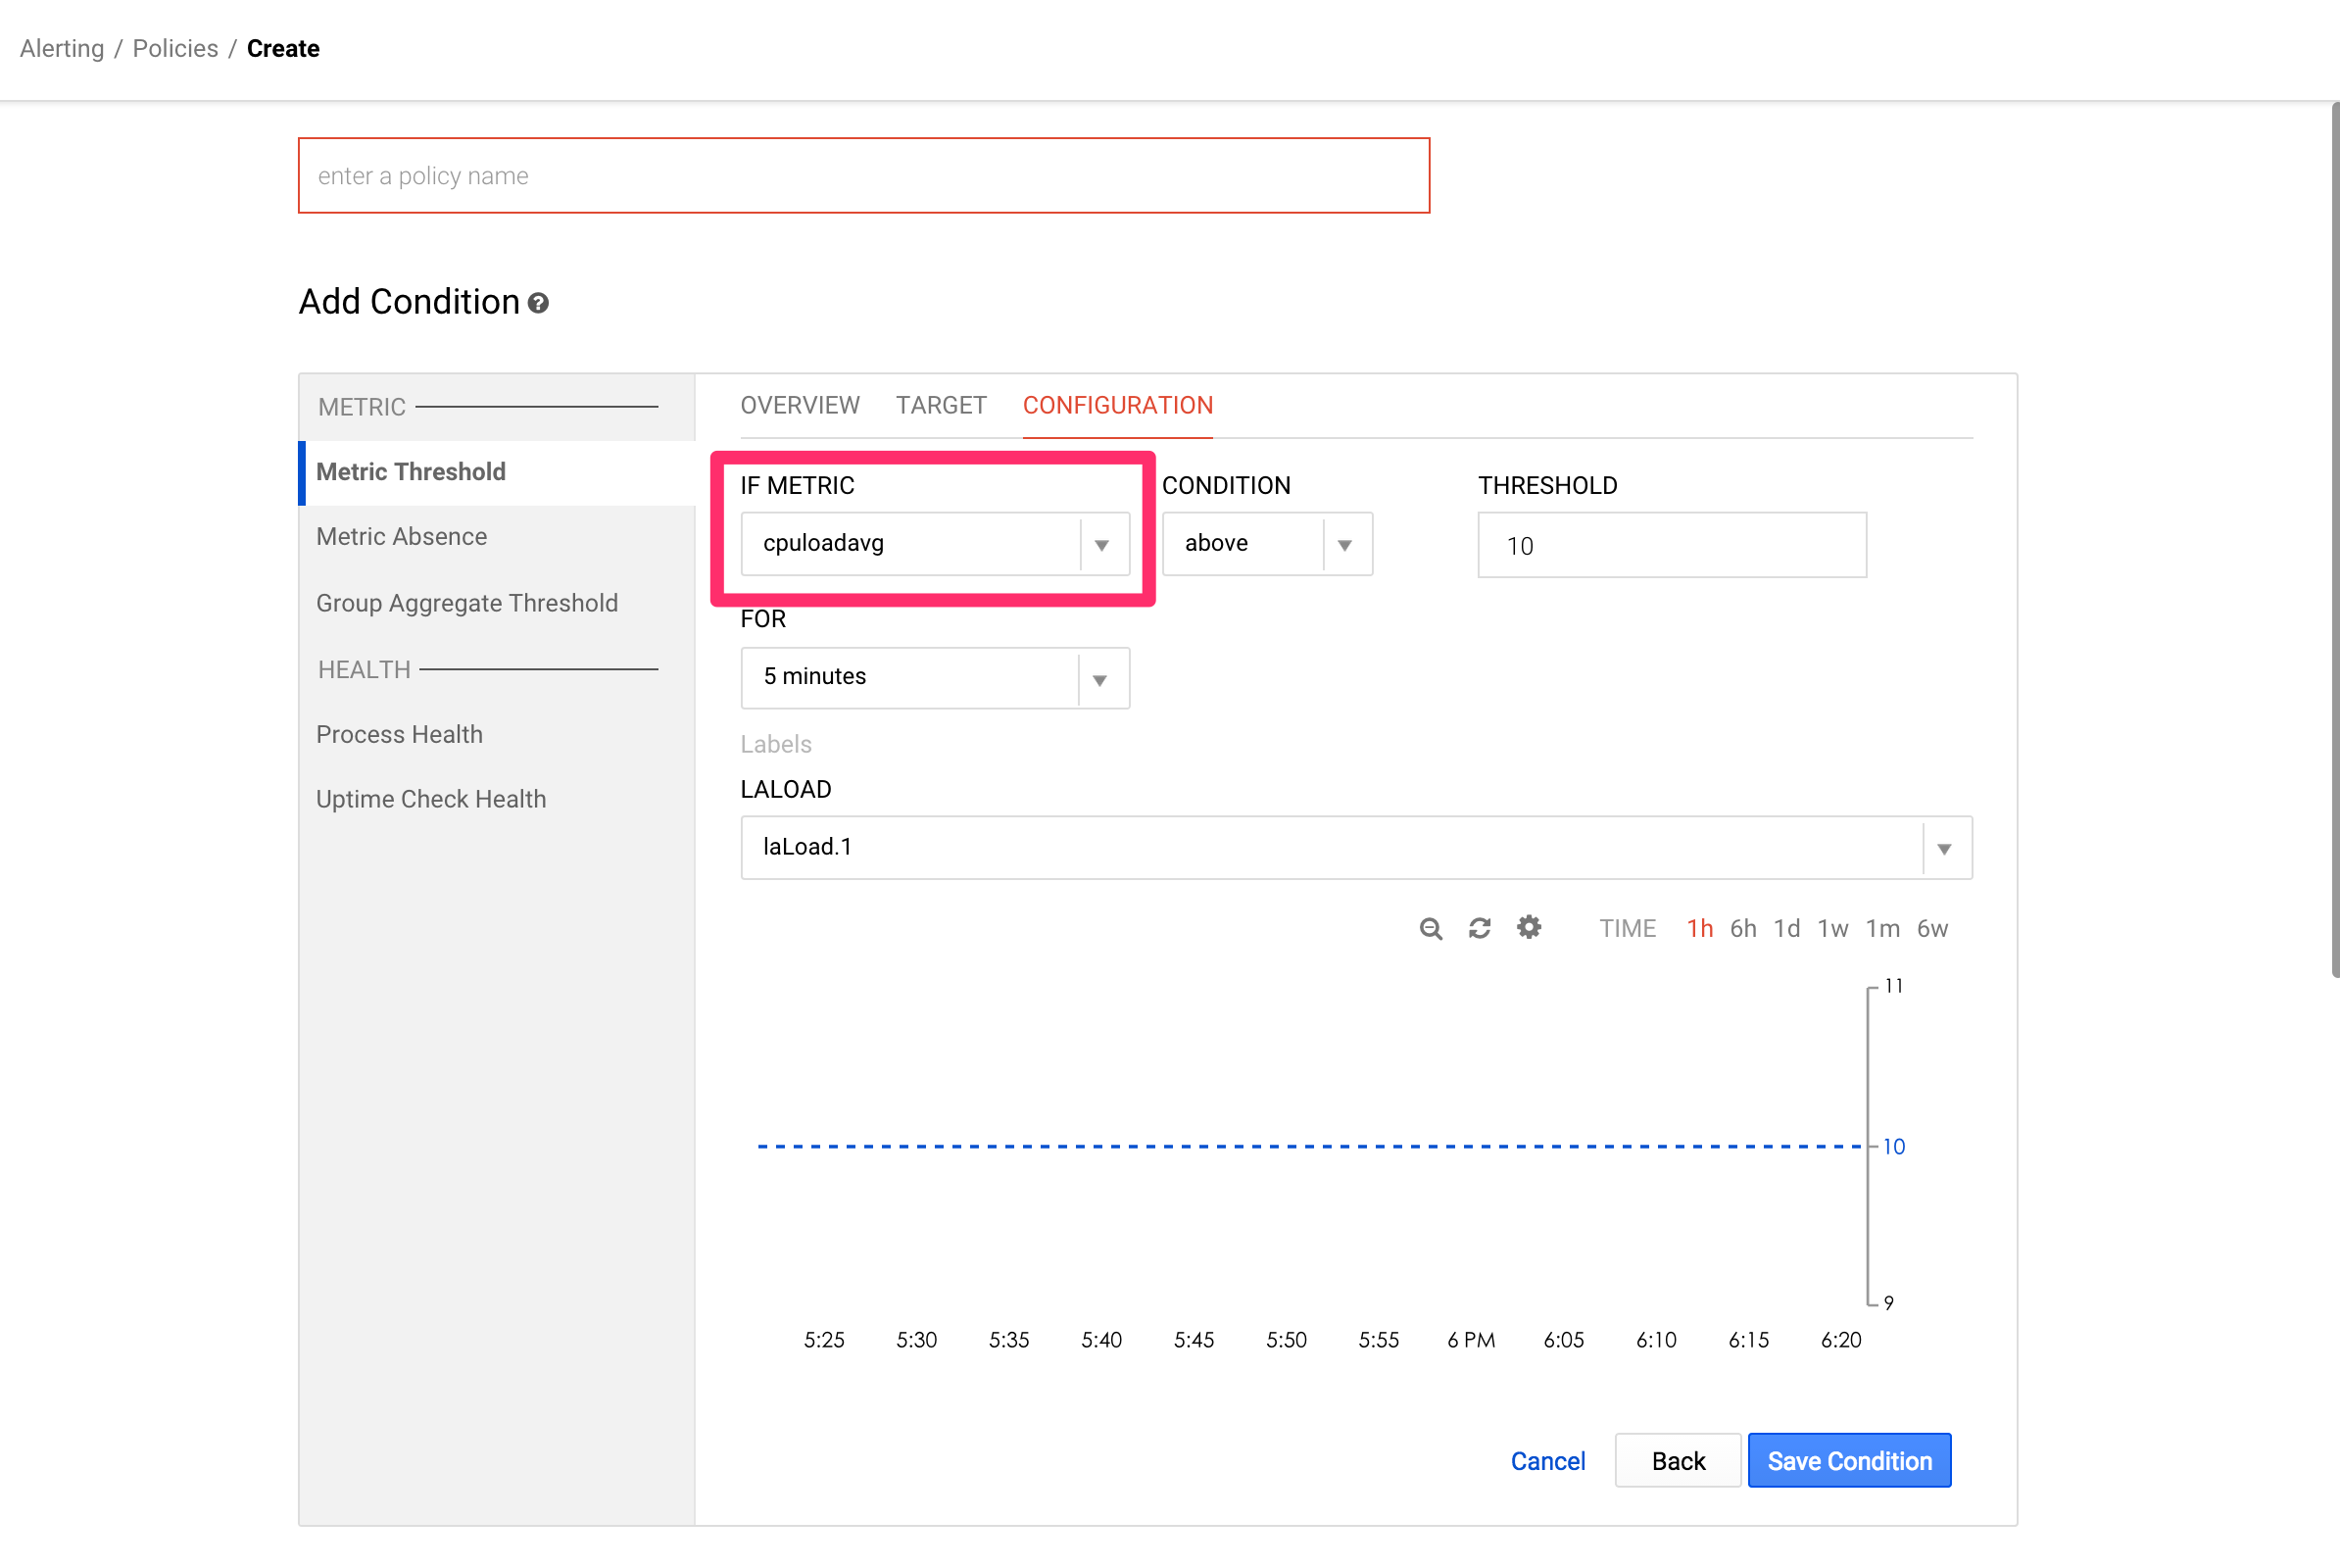
有了圖表,接下來可以建立自己的告警功能,透過StackDriver功能列Alerting > Create Alerting Policy可以建立通知告警!